Click here to download this week's dataset as a CSV
Click here to download this week's dataset as a Hyper Extract
Data Storytelling and Data Viz Approach
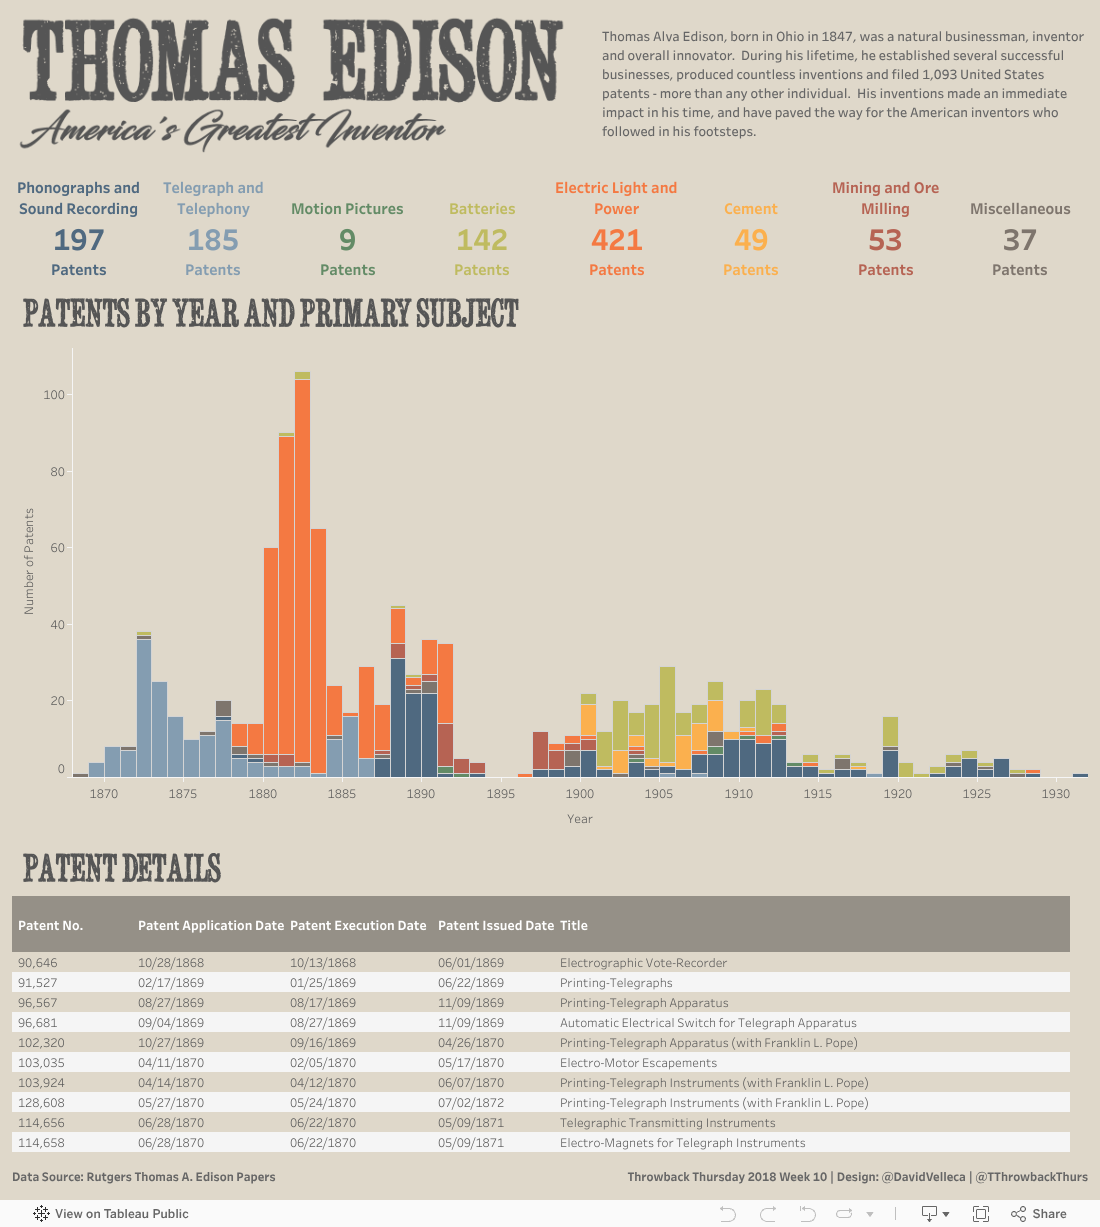
I wanted to look at the number of patents by Primary Subject as well as over time. To meet this desire, I used a clear set of BANs, as well as a stacked bar chart by year. The BANs are interactive - clicking on them will filter the bar chart, as well as the crosstab at the bottom. Similarly, clicking on any part of the stacked bar will filter the crosstab at the bottom - both by Primary Subject and year. Finally, I used URL click actions to drive the user to a PDF of the patent application, courtesy of the wonderful collection on the Rutgers website. This action is dependent on a calculated URL that concatenates the patent number with a base URL.
Nothing else too fancy this week, this was a quick but pretty enjoyable Viz to create.
Data Notes
Some of Edison's patents deal with multiple subject areas. For the purposes of this datasource, I chose the most appropriate, and included it in the datasource as the 'Primary Subject Matter.' These subjects were gleaned from the Rutgers site cited below.
Data Source
This week's data source comes from Rutgers University's School of Arts and Sciences Thomas A. Edison Papers. This site was also used for information in this historical background.